- Invest with Confidence
- Posts
- [Part 3/3] TSMC is the business you've been looking for
[Part 3/3] TSMC is the business you've been looking for
Let's hope the price is right. Decision time.

Welcome back to Invest with Confidence! I take deep technical and financial knowledge, and distill it down to an easy-to-understand report. You won’t need any engineering or financial background to gain a lot of value from this article. I’ll frame all the key takeaways in simple terms so you can understand their significance. By the end, you’ll be able to have an educated, high-confidence opinion on the company.
If you’re new to this publication, I recommend checking out the quick start guide. It’ll tell you what to expect from these articles, and get you excited for what’s to come.
👋 Introduction
The final part of our deep dive into TSMC. If you didn’t read the previous articles, you’ll need that context before continuing:
It’s been a fascinating exploration so far, and by the end of this article, we’ll have a go/no-go decision on this investment opportunity. Let’s dive in!
Understanding the valuation
The key ratios
Like we did with the financials, let’s take a moment to quickly discuss the significance of the financial ratios we’re going to talk about:
Market capitalization is the total value of the company’s shares. It’s the share price multiplied by the number of shares in the company. If a company is trading at $10 a share, and it has 100 shares, then its market capitalization is $1000. This is often more informative than just looking at share price. Consider this example: company A is trading at $30 per share while company B is trading at $900 per share. One might assume that company B is more expensive. But company A has 10 billion shares, making its market cap $300 billion, and company B has has 100 million shares, making its market cap $90 billion. Looking at market cap allows us to understand the relative size and value of companies.
Price-to-earnings (P/E), price-to-cash-flow (P/CF), and price-to-book (P/B) ratios are ways of quantifying how much of a premium I’m paying to acquire an asset1 . The higher the ratios, the more of a premium I’m paying. Consider buying a house. If I had it on good authority that a house was worth $500,000 and the seller was offering me a price of $3 million, I wouldn’t buy. But if they were offering me a price of $550,000, I’d be more inclined to buy. You can think of P/E, P/CF and P/B as serving a similar purpose - it provides a measurement of how much above intrinsic value I have to pay. Keep in mind, there’s no “correct” value for any of these ratios. A company with a very low P/E could be a good bargain, or it could be mismanaged and on its way to $0. A company with a very high P/E could be extremely overvalued, or it could be on the cusp of sustained growth.
Price/earnings-to-growth (PEG) ratio incorporates the PE ratio and adjusts it for expected growth. If a company has a high PE, but is expected to grow significantly over the next few years, then the PEG will be more moderate. A company that has a share price of $20, EPS of $2, and an expected earnings growth rate of 7.5% a year will have a PEG of (20 / 2) / 7.5 = 1.33. The closer a PEG is to 1, the more fairly it is considered to be valued (a PEG < 1 would be considered undervalued).
Now, with that context, let’s look at TSMC’s valuation ratios.
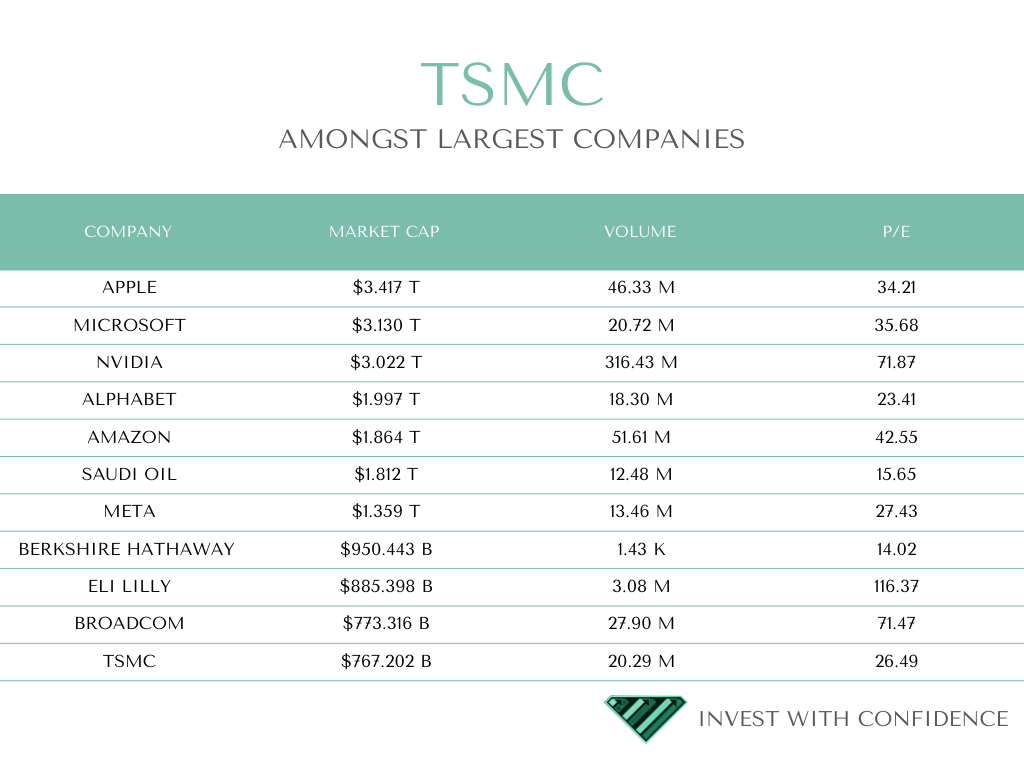
The market cap is ~ $770 billion, good for 11th in the world. That might seem high for a non-consumer-facing company, until you realize that 8 of the top 10 companies in the world rely heavily on TSMC’s products. (And one could argue that the other two, Saudi Oil and Eli Lilly, need modern compute to manage and operate their businesses.) Without TSMC, the largest companies in the world would suffer greatly.

The P/E, P/CF and P/B ratios are all high compared to the S&P, meaning that we’d be paying a more significant premium to acquire stock in TSMC. Equally important, they’ve all had a consistent trend over the last 6 quarters - increasing by between 1.5x and 2.5x. It’s unsurprising given the increase in share price over that same period. But, the good news is that it’s not that high compared to the tech and semiconductor industries. By no means a bargain, but nor is it sticker shock.

The PEG ratio is 1.54, a healthy number in my opinion. For future earnings growth, I used 17% - their average over the last 30 years, and smack in the middle of their projection range for the upcoming years. Frankly, I think future earnings could be higher, given the potential for AI-driven demand growth.
Overall, I see the recent success of the company driving an increase in price, and therefore the valuation ratios. But it’s nothing that I find shocking or unsustainable, in fact the strongest takeaway is that I think TSMC could easily keep this up for the next 5-10 years.
What is the discounted cash flow analysis (DCF)?
DCF is probably the most financially technical aspect of my articles, and it can be a useful tool for having confidence in your investment decisions. I don’t use it as the driver of my investment choices, but instead as a quantitative-ish tool that acts as a double-check of my thesis. If the DCF provides projected share prices that are wildly different than my expectations, it’s an indication to look more closely at the company’s financials or my assumptions in the model.
In layman’s terms, what does the DCF do? Simply, it takes the projections for what a company will make in the future, and attempts to find the value of that in today’s dollars. Let’s consider a game:
I roll a dice.
Every time it shows 1-4, I get $5.
Every time it shows 5 or 6, I lose $5.
What’s my expected total value? Let’s break down the odds.
There’s a two-thirds probability of the +$5 outcome, and one-thirds probability of the -$5 outcome.
For a single roll, the expected value is
(2/3 * 5) + (1/3 * -5) = $1.66.If I rolled 100 times, my expected total value is
100 * 1.66 = $166.
The DCF is similar to that. It’s taking the possible outcomes that could happen in the future, and adjusting them based on the likelihood that they’ll come true. If I’m extremely confident that a company is going to have 100% growth every year for the next 10 years, then its projected share price is going to be very high. (Imagine in the game if the dice only had 1-4 on it. Then I’d know that I would get paid every single roll. Expected value, very high.) But if I am not confident in the future cash flow growth, then the projected share price will be much lower, since there’s a higher probability that something could go wrong.
That should give you some context when you see the scenarios in the DCF analysis. A conservative scenario means I’m assuming the future holds less cash flow growth and less certainty; an optimistic scenario means I’m assuming the future holds more of both.
Discounted cash flow analysis
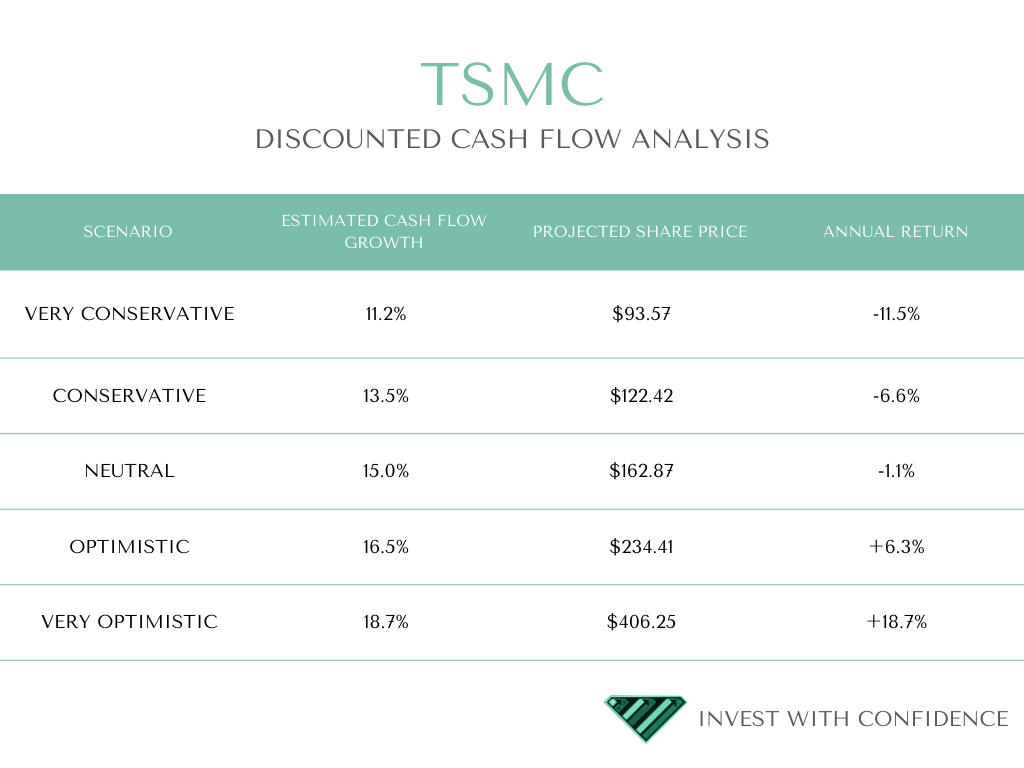
Let’s run the scenarios for TSMC:

Certainly some interesting numbers to look at here. Given how promising the business is, I feel confident that either of the last two scenarios could become reality. But there’s still a big difference between those two outcomes.
In the optimistic scenario, a 6.3% annual return isn’t bad, but it would likely underperform the S&P500. It wouldn’t make sense to take a risk by investing in a single company when I could get a better return from a diversified basket of stocks.
If the very optimistic scenario came to fruition, then the risk would be worth it. 18.7% annualized return would be great.
But here’s where the DCF is not an exact science. These aren’t two discrete possible outcomes - there are infinite outcomes up and down the scale. The DCF is helpful because it quantifies (to some degree) your sentiment on the company. In this case, if you’re anything short of very bullish on TSMC’s future, you may decide that it doesn’t make sense to invest, based on the projected range of share prices.
If you want to read about some of the assumptions for the DCF model, check the footnote.2
Takeaways from the valuation section
The valuations show a company that has had a significant run-up in share price over the last few quarters, but without necessarily going into bubble or absurd territory. Future projections show that I’d need to have a rosy outlook on TSMC’s prospects in order to get rewarded by the share price.
But here’s the thing - I do have a rosy outlook on their prospects. The company is expensive, sure, but as mentioned earlier it’s not in bubble territory. Far from it.
Conclusion (aka decision time)
This deep dive into TSMC has been a fascinating learning experience. I was aware, more or less, of their importance in the global supply chain, but I didn’t have a concrete understanding. After a few weeks of research, it’s clear that I underestimated how vital TSMC truly is. They may not be exaggerating in their investor letters when they say that “semiconductor technology is the foundational tech for the modern digital economy”.
TSMC has unassailable excellence in their engineering and manufacturing processes. The moat around them is too wide to be seriously challenged any time soon. Everyone in the world is trying to compete with them; failing that, everyone in the world wants to work with them.
Their leadership and financial management has been consistent, dependable under pressure, and decidedly long term. They’ve demonstrated an ability to guide the company through good and bad times, and all signs point to that trend continuing.
The financial health of the company is awesome. There are no obvious red flags. As far as valuation is concerned, the company is certainly not cheap. I’d describe it as expensive but not overvalued. If I was primarily driven by the “fair price” part of “needing to buy a business at a fair price”, I’d be forced to pass on the opportunity to buy TSMC.
However, my personal risk appetite allows for buying an expensive company if I believe the growth prospects outweigh the price premium. And in this case, that’s exactly what I believe. TSMC has had impressive growth, and I see plenty more of it coming over the next 5-10 years. I plan to take (and grow, over time) a position in TSMC, and I look forward to being along for the ride.
Did you like this article? Do you disagree with everything I’ve said? Let me know in the comments!
⚠️ This is not investment advice.
1 These ratios are widely available from your typical trading platform. I’m not doing any calculations here, just using what’s published.
2 I calculated a discount rate of 5.3%. That’s pretty generous in my mind - in other words, it expects that a lot of the future cash flow will be delivered. I used perpetual growth rates of between 2.5% and 4.5%. I ran a handful of scenarios to see the impact of different values on the outcome. The conservative scenarios use a lesser cash flow growth and lesser perpetual growth rate. The optimistic scenarios use a higher cash flow growth and higher perpetual growth rate.
Reply